
Scale · Full Plant Design & Execution
End-to-End Plant Design and Execution That Actually Runs
Scaling isn't buying a bigger machine — it's a system: equipment, layout, utilities, people, and controls working as one. We find the real constraint first, then design and execute the whole system, from assessment to full-rate startup.
Engagement at a Glance
- Typical range
- $28K assessment to $1M+ build
- Duration
- 2–3 weeks to assess; 8–14 weeks per execution phase
- Structure
- Assessment first, then phased execution
- Deliverables
- Capacity model, system design, installed and commissioned line
- Method
- Theory of Constraints — station by station
- Ends with
- Your line running at rate without us in the building
An engineer responds within one business day.
What you get
1. Outcomes
The real constraint, named
Most capacity problems aren't where they look. We measure every stage, decompose true OEE, and put money only where the bottleneck actually is.
A line that grows with you
Designed for the phase after this one — so next year's growth is an add-on, not a rebuild.
Cost per unit goes down
The design does the cost-cutting: less waste, fewer touches, tighter changeovers. Your margin improves because the process did.
How it works
2. The Process
Step 1
Assess and model
We walk your operation and build a stage-by-stage capacity model with measured rates, not nameplates. The constraint gets named, with numbers behind it — and often it isn't the machine you were about to buy.
Step 2
Design the system
Equipment, layout, utilities, and controls as one integrated design, with scope, schedule, cost, and acceptance criteria you approve before anything is bought.
Step 3
Execute
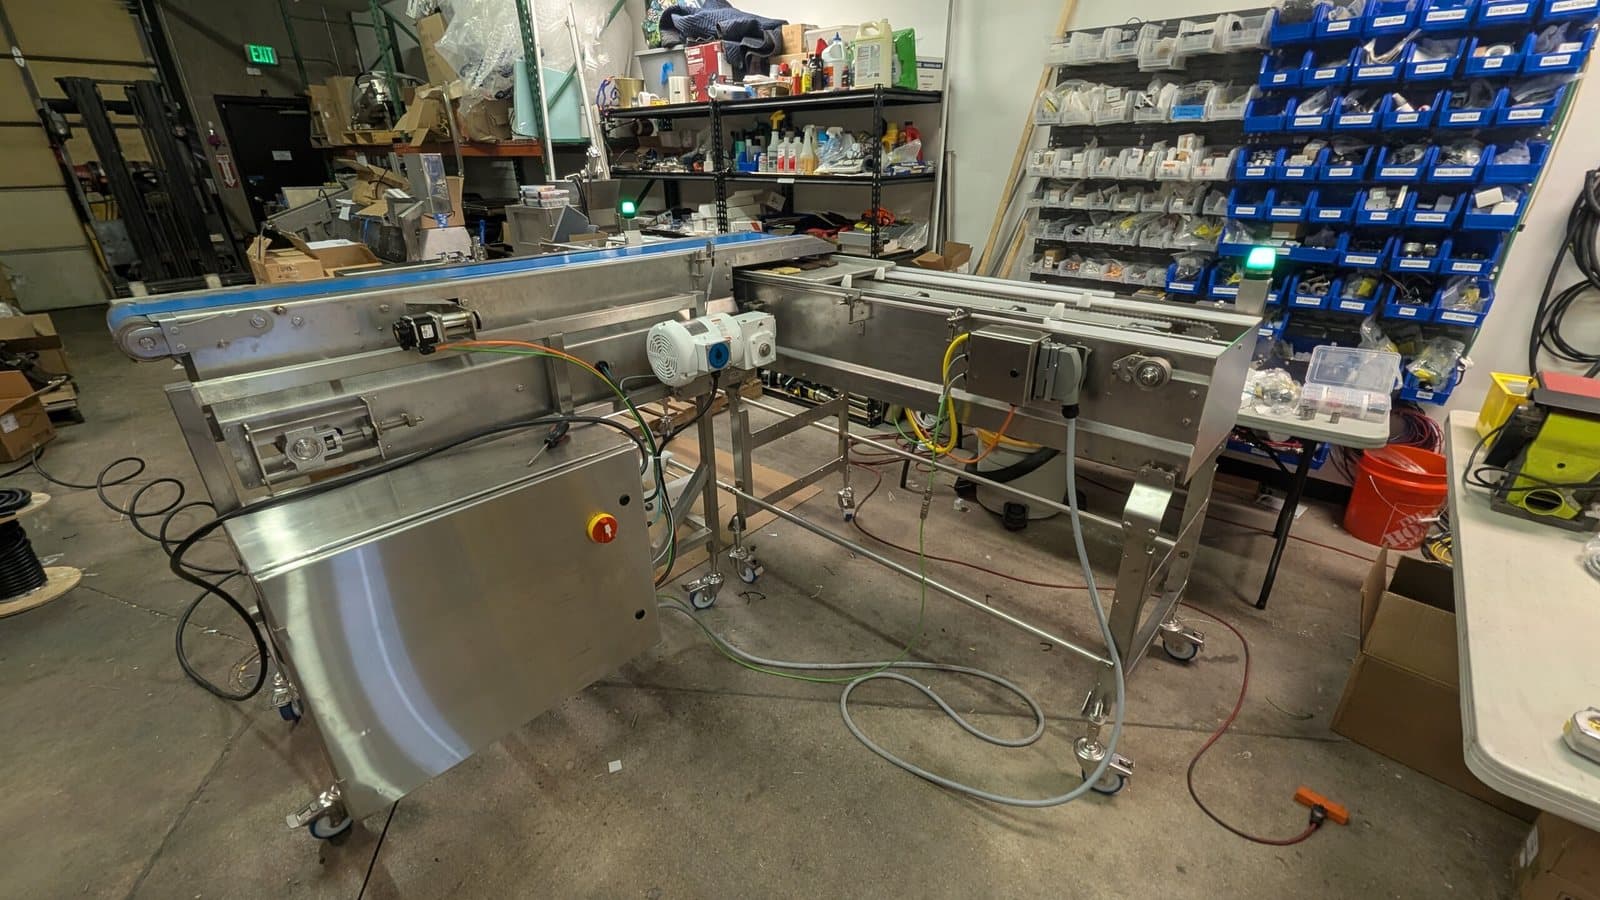
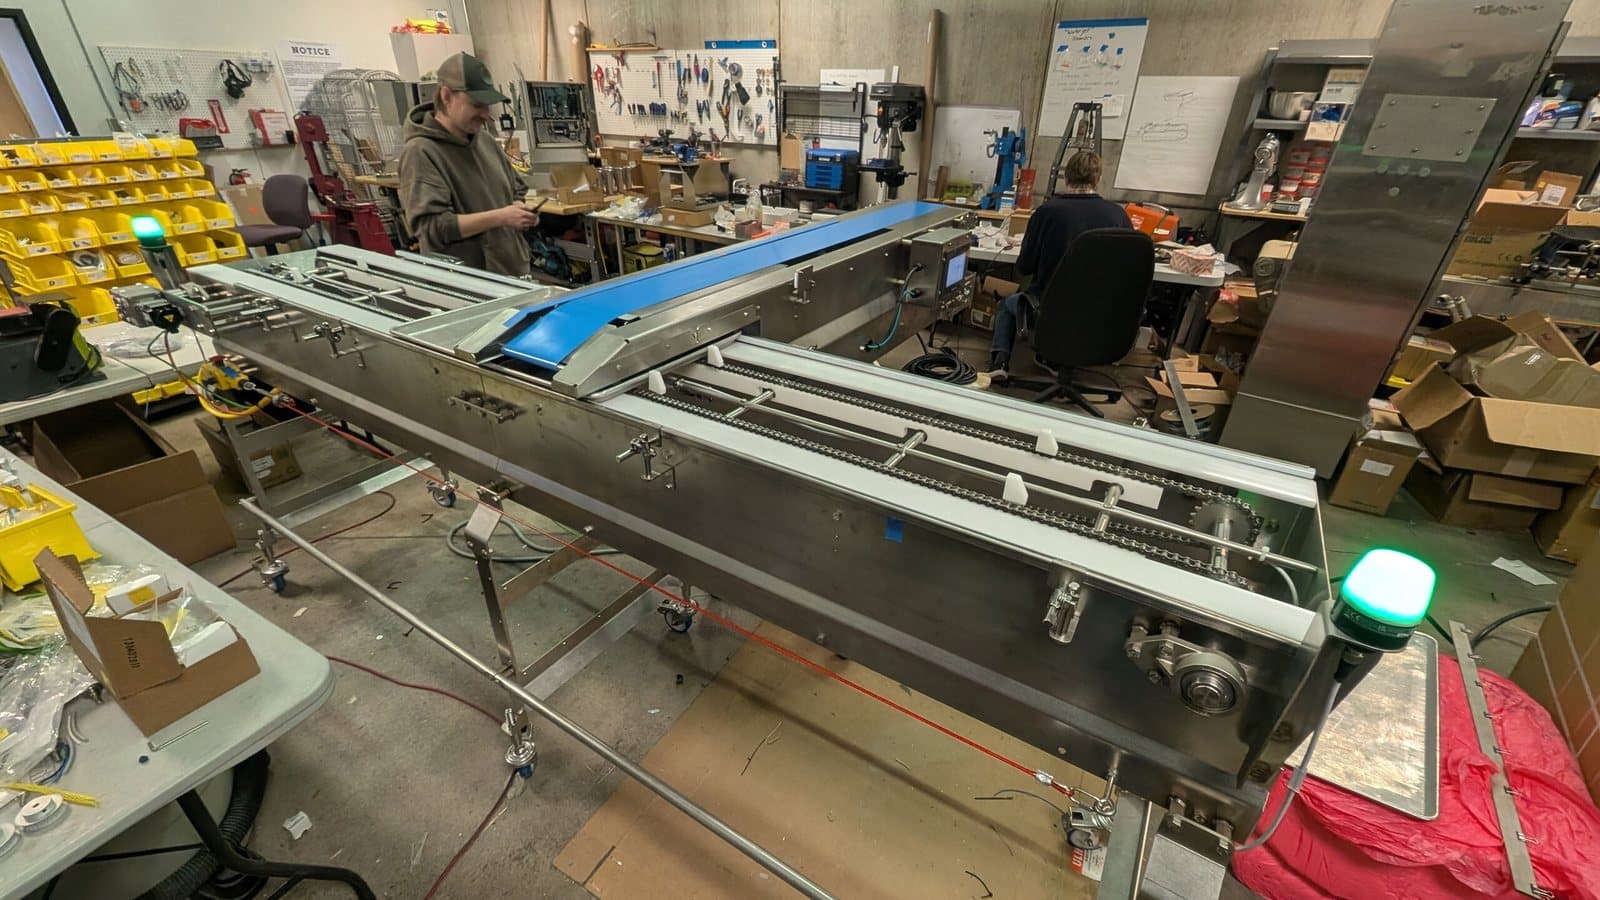
Procurement, fabrication in our shop, installation, integration. One team owns all of it — including the utilities and facility work that usually falls between trades.
Step 4
Start up at rate
Commissioning with your operators until the line hits its numbers, then training and documentation so it keeps hitting them.
Proof
3. Recent Work
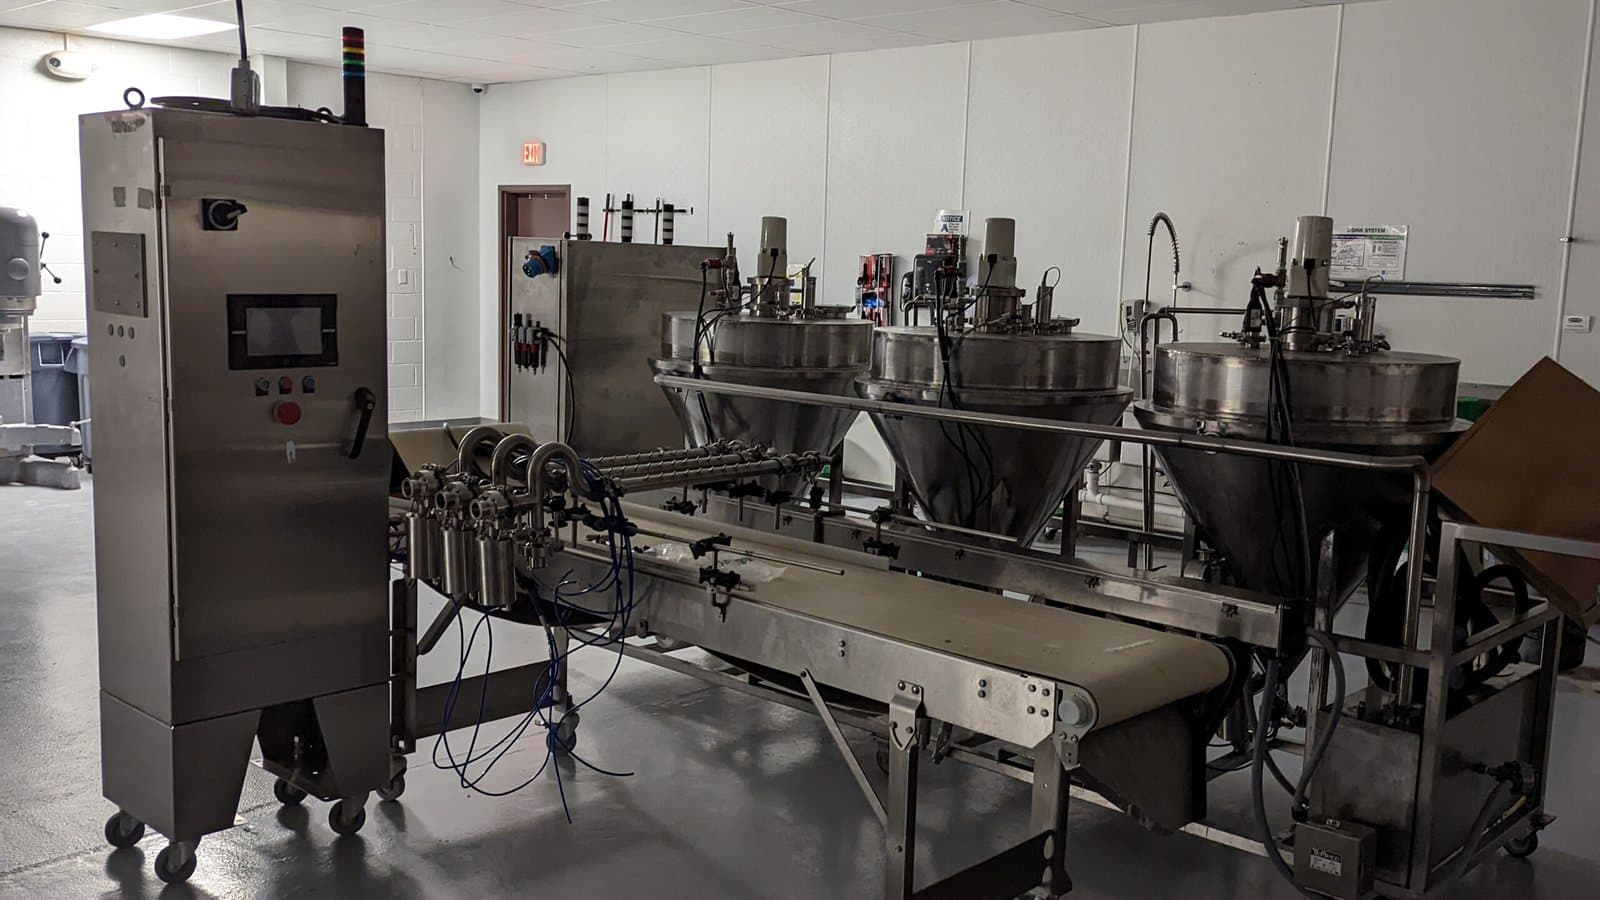
Recent: a capacity assessment for a refrigerated foods manufacturer found the bottleneck wasn't the filler they were about to buy — it was the chill loop — and true OEE was running near 58% against an assumed 95%. The added capacity they needed was already sitting in their own facility.
Related reading: New line or retool? A decision framework · Why your capacity model says 95% and your line says 58%
Ready to Build Production You Can Count On?
Tell us what you're up against. A real engineer will respond within one business day — no pitch, no pressure.
Schedule a Discovery Call